Glycemic
Research Institute®
601 Pennsylvania Avenue
Suite 900
Washington, D.C
20004
Protocols
for Analyzing &
Testing Pet Foods
June 2009
|
The following methodologies are utilized in determining
the Glycemic and Diabetic properties of pet foods. Following
HPLC/U-HPLC analysis, the data is cross-analyzed with Glycemic
Research Institute (GRI) records of known glycemic
indices of raw materials, and assigned a glycemic and diabetic
index. Per GRI Certification Protocols, pet foods that meet
the criteria are legally (FDA/FTC) allowed to display the
GRI Certification Mark (s) on labels and attendant marketing
material, which signify specific claims.
High
Speed Liquid Chromatography
HPLC and U-HPLC |
| • |
Conventional and ultra-high pressure modes |
| • |
Optimized
performance for sub two micron particle columns |
| • |
Isothermal
injection and separation enhances reproducibility |
| • |
Innovative
LightPipe™ technology for increased sensitivity |
| • |
Rapid
peptide identification and quantitation |
| • |
Fast
efficient separations of metabolic profiles |
| • |
Ballistic
gradient small molecule identification |
| • |
New
columns geometries and particle sizes for improved
speed, resolution and/or sensitivity |
QUATERNARY
PUMP/ISOTHERMAL INJECTION
A quaternary pump with only 65 microliters of delay volume,
assuring rapid transfer of even the most complex gradients
from the pump to the column. Isothermal injection and separation
provide superior reproducibility by eliminating all external
environmental influences to the chromatography.
HPLC ANALYTICAL ANALYSIS
Food compounds in pet foods analyzable by HPLC include amino
acids, peptides, proteins, lipids, carbohydrates, sugars,
sweeteners, alcohols, vitamins, organic acids, organic bases,
mycotoxins, additives, preservatives, colorants, antimicrobial
residues, pesticide residues, bittering substances, phenolic
compounds, pigments, nitrosamines, growth promoters, anions,
and cations.
ASSAY PRINCIPLES: PROTEINS
Protein
interactions are analyzed using a label-free detection method.
Sample in solution is injected over a sensor surface on
which potential interacting partners are immobilized.
As
the injected sample interacts with the immobilized partners,
the refractive index at the interface between the sensor
surface and the solution alters to a degree proportional
to the change in mass at the surface.
Surface
plasmon resonance (SPR) is exploited to detect these changes
in real time and data are presented in a “sensorgram” (SPR
response plotted against time).
Concentration
test assays are designed as indirect (inhibition) assays.
A known concentration of a relevant binding protein is mixed
with the sample and injected over a sensor surface on which
a corresponding derivative is immobilized.
Any
target molecules present in the sample bind to the binding
protein and so inhibit it from binding to the sensor surface.
The higher the concentration of the target molecule in the
sample, the higher the level of inhibition, and hence the
lower the SPR (see below) response.
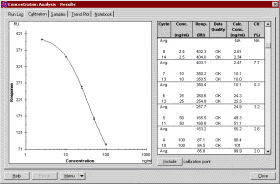
Concentrations
are calculated by interpolation of the binding responses
on a calibration curve.
DATA
SYSTEMS
Method transfer calculators for isocratic method and gradient
method transfer
Xcalibur MS data system
ChromQuest Chromatography Data System (CD)